Graphs
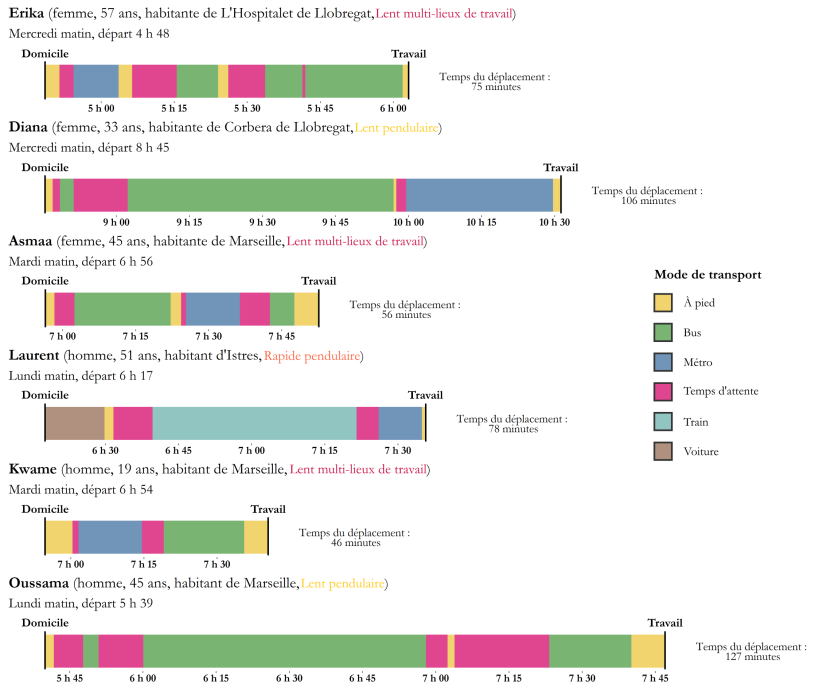
Observing the combination of means of transport and waiting time
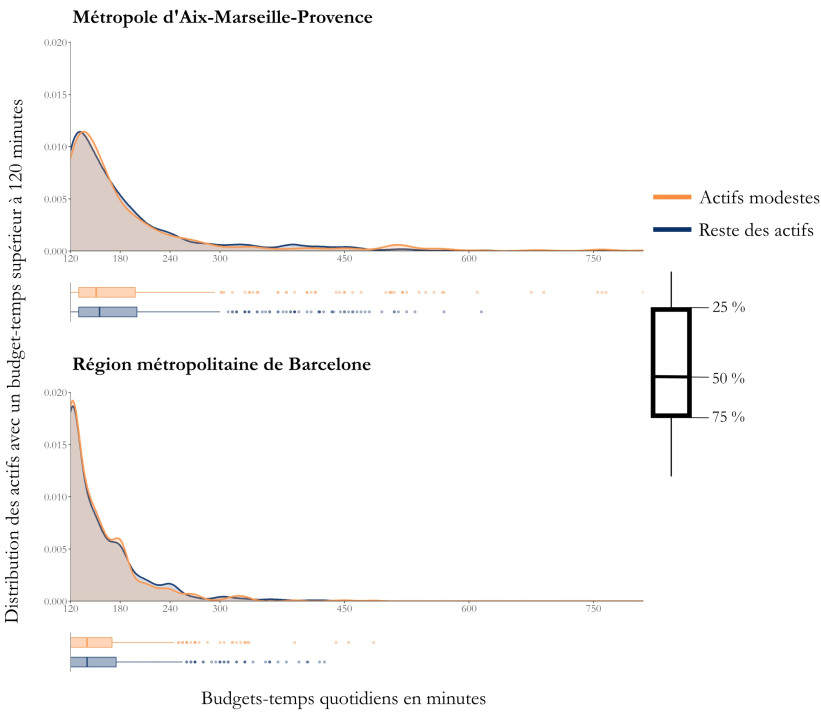
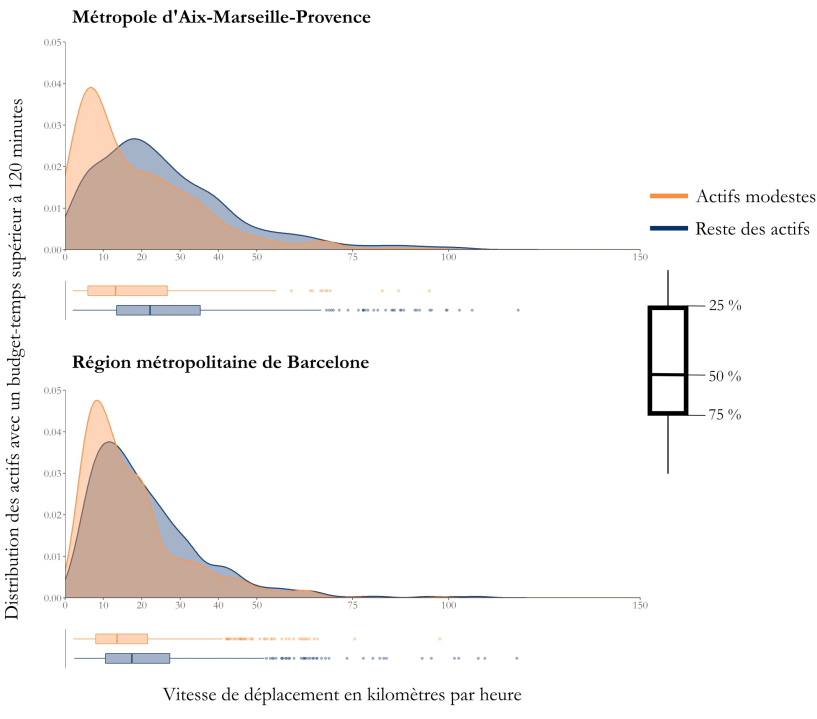
Comparing the distribution of a variable
 |
 |
|---|---|
| Time | Speed |
Presenting the sample of my PhD research
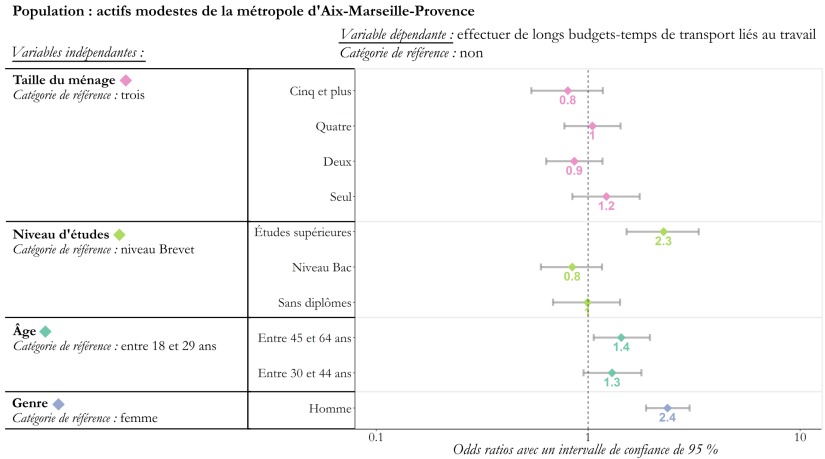
Presenting results of a logistic regression
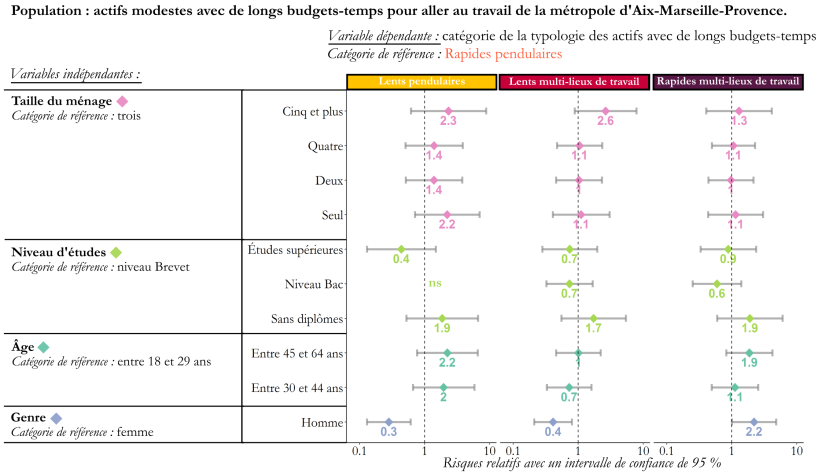
Presenting results of a multinomial logistic regression
Maps
Presenting the sample of my PhD research (place of residence, daily mobility and place of birth)
| Metropolis of Barcelona | Metropolis of Marseille |
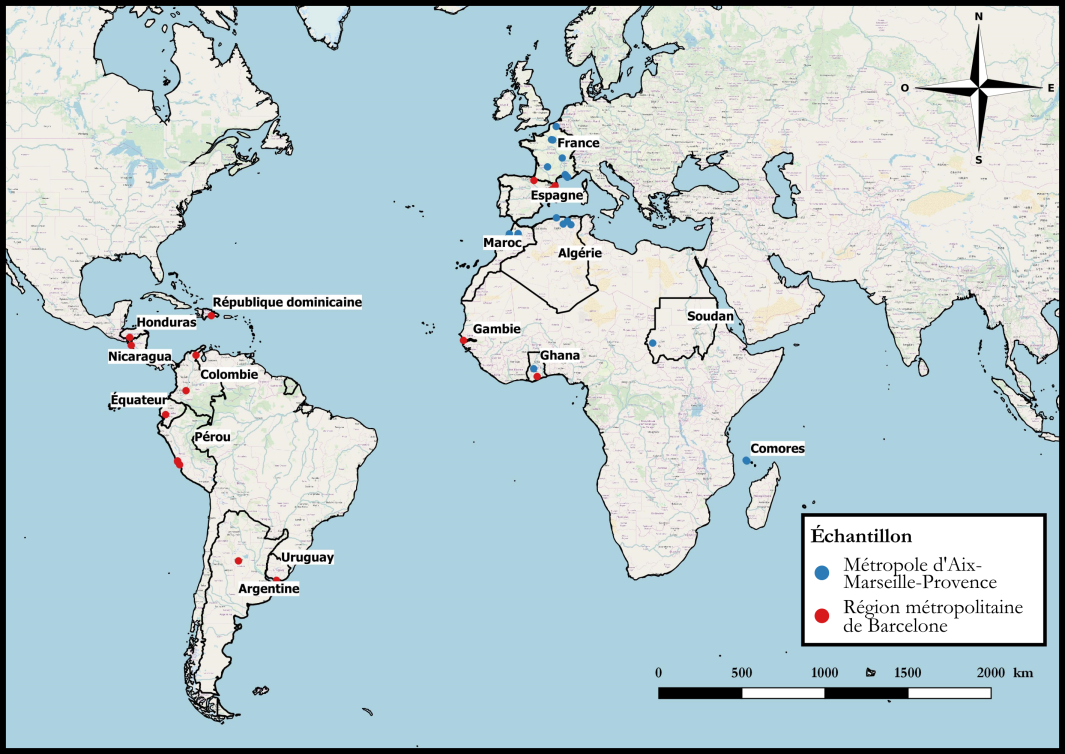 Places of birth of the individuals from my sample
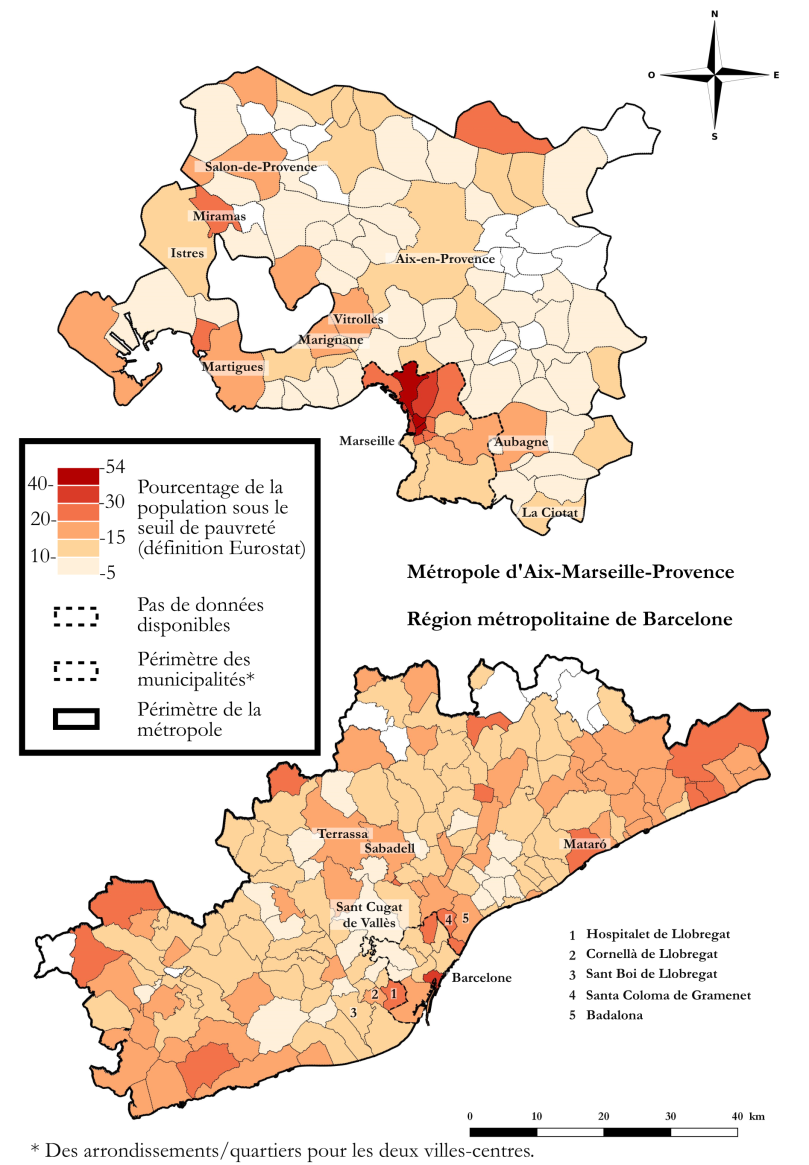
Comparing two metropolises
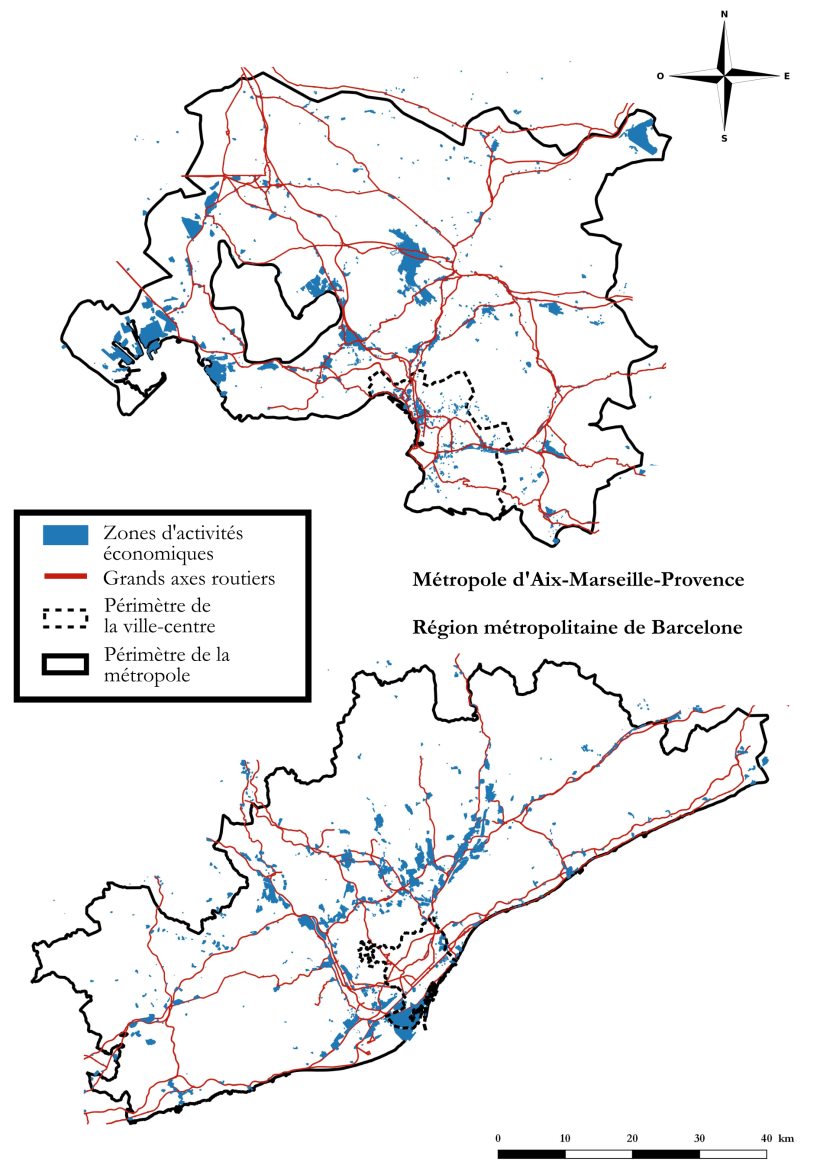 |
 |
|---|---|
| Road network and economic activity zones | Distribution of the poverty rate |
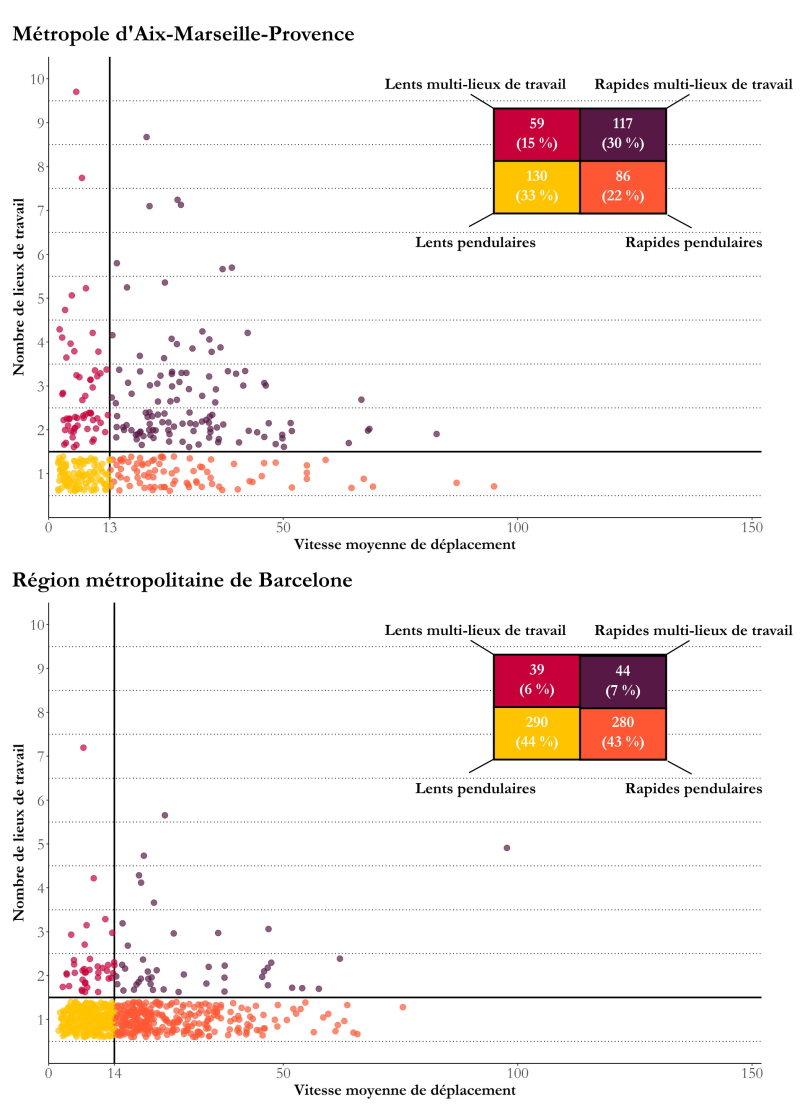
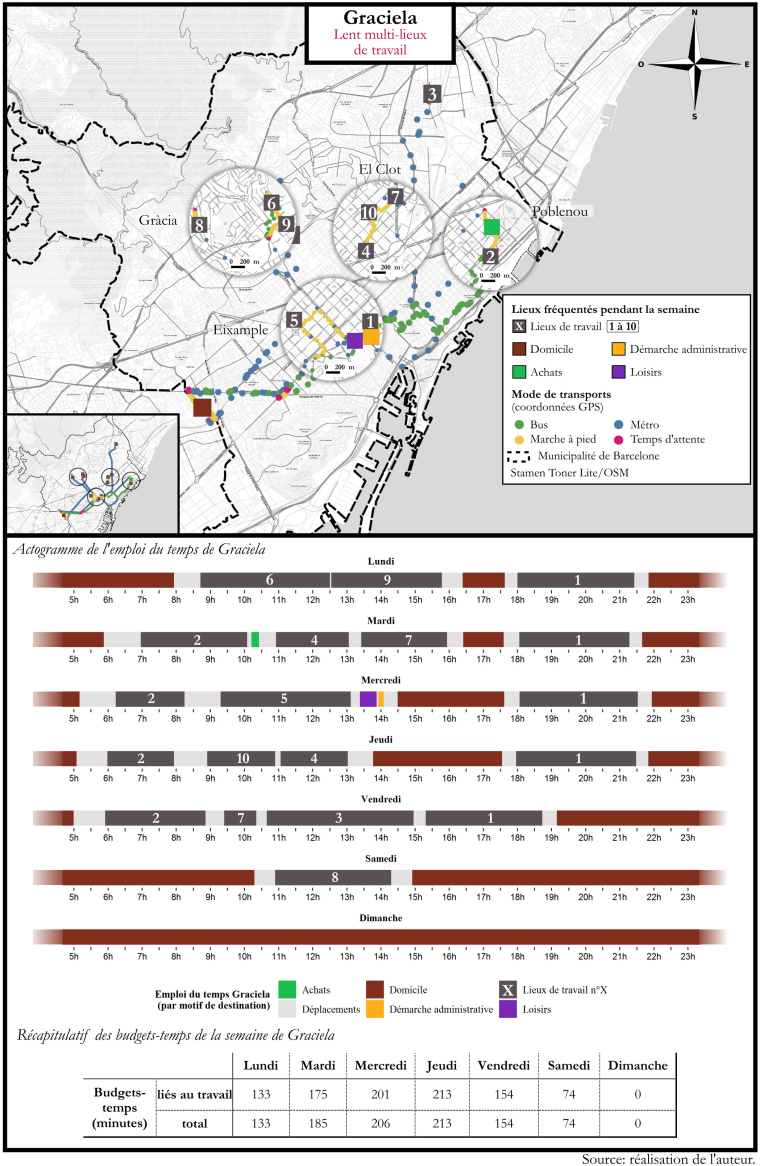
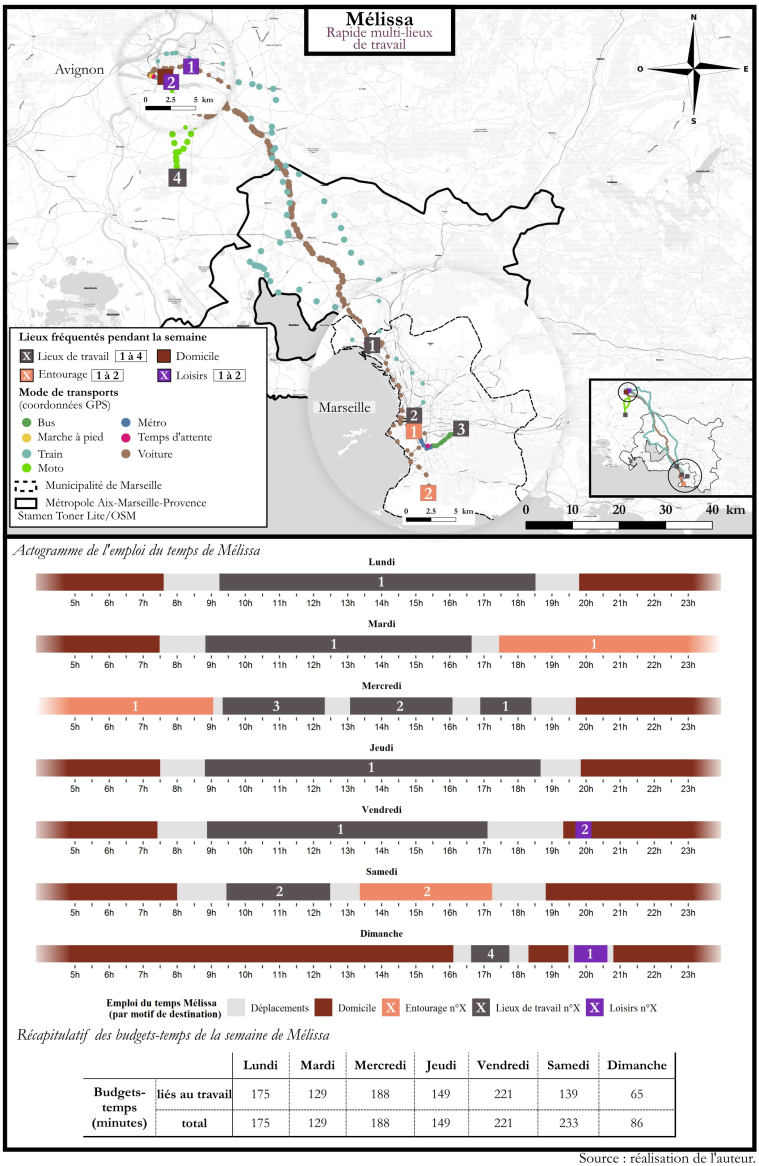
2D Spatio-temporal approach to daily mobility
 |
 |
|---|---|
| Metropolis of Barcelona | Metropolis of Marseille |
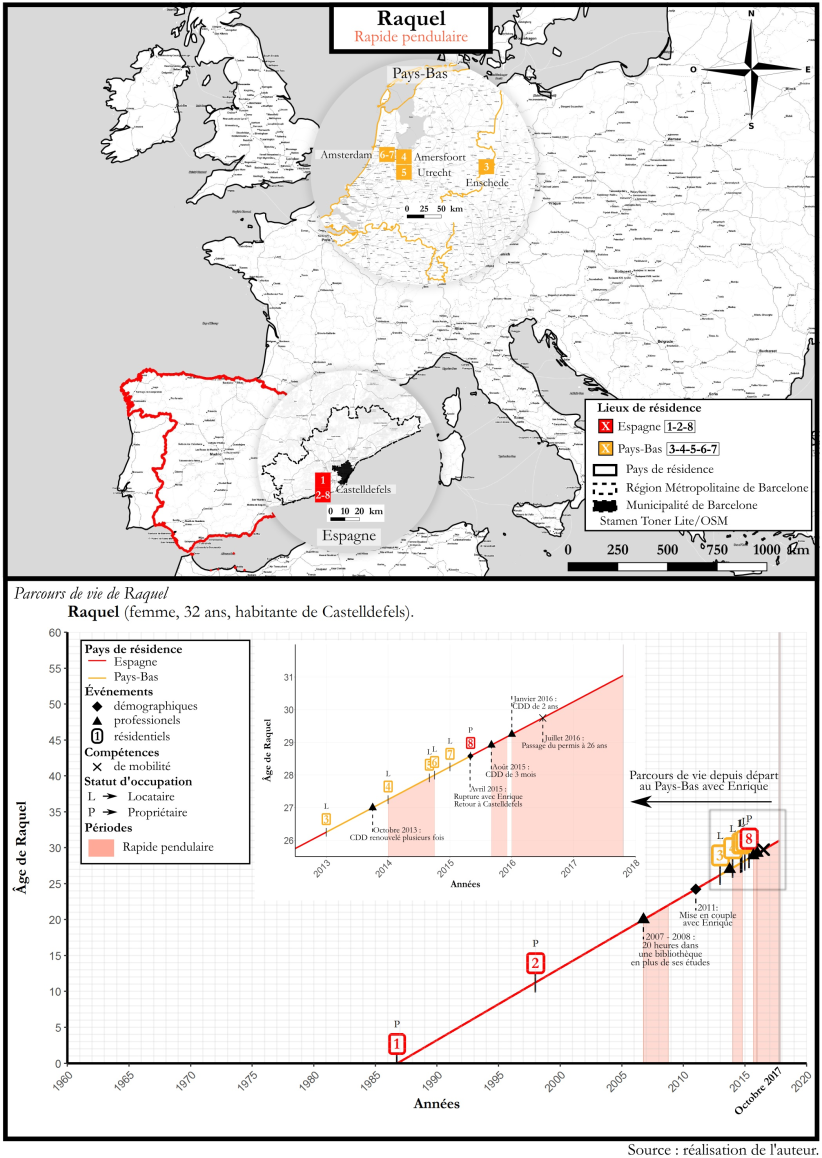
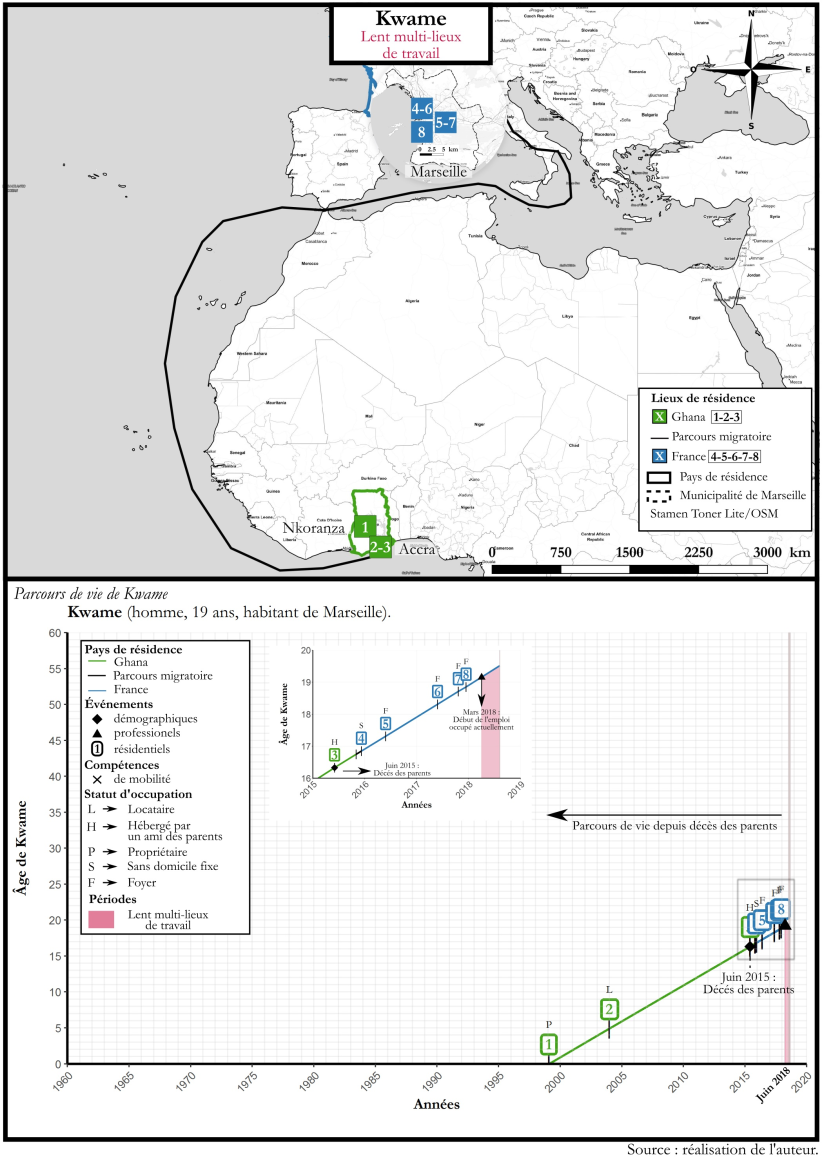
2D Spatio-temporal approach to life courses
 |
 |
|---|---|